Title

Submission

  1. General Inputs
    1. Start by selecting a reference set from dropdown menu. This option should represent the phylum/subphylum of your genome.
    2. DO NOT forget to select the library layout of your RNA-seq analysis.
    3. If no organism name provided, it will be set as "Unknown organism".
    4. You can either give an NCBI accession number or provide a genomic sequence file in fasta or genbank format. However, if it is possible, giving accession numbers are recommended since otherwise a new annotation will take place.
    5. If you have clusters that cannot be found by antiSMASH, you can give your own clusters with genes names as their locus tags in a simple .txt file that can be seen here. In the example there are two clusters from Streptomyces Coelicolor. Please make sure that the "genes" there are from "locus tag"s.
    6. Providing an email address is recommended since your analysis can take some time to process depending on the queue.

  1. Experiment based Inputs
    1. First, please select your analysis type. First option (highlighted) will download given SRA accessions and start a comparative SeMa-Trap run.
    2. Second option will again take SRA accessions but this time the analysis will be based on only one condition to give pointers on how to design a comparative transcriptomics experiment.
    3. Using third option, it is possible to upload "bam" files. However, please be patient when uploading data and DO NOT close the browser since it might take some time depending on your file size.
    4. When providing accession numbers or "bam" files, all the data belonging to a condition (e.g. "Control") should go in to their respective columns. For example, the accession numbers "ERR2313920" and "ERR2313921" belong to the condition "single culture" and numbers "ERR2313922" and "ERR2313923" belong to the condition "coculture".
    5. Same mentality applies to uploading "bam" files. For "Single Condition Analysis" you only have one condition and the replicates belong to it.
    6. WARNING! When providing another experiment, please use unique condition name if the sequencing data comes from another source and is unique. SeMa-Trap compares conditions and experiments with each other, therefore it is important to use unique names for different datasets. On server, the analysis is limited to 6 experiments.

Results

Overview of detected BGCs

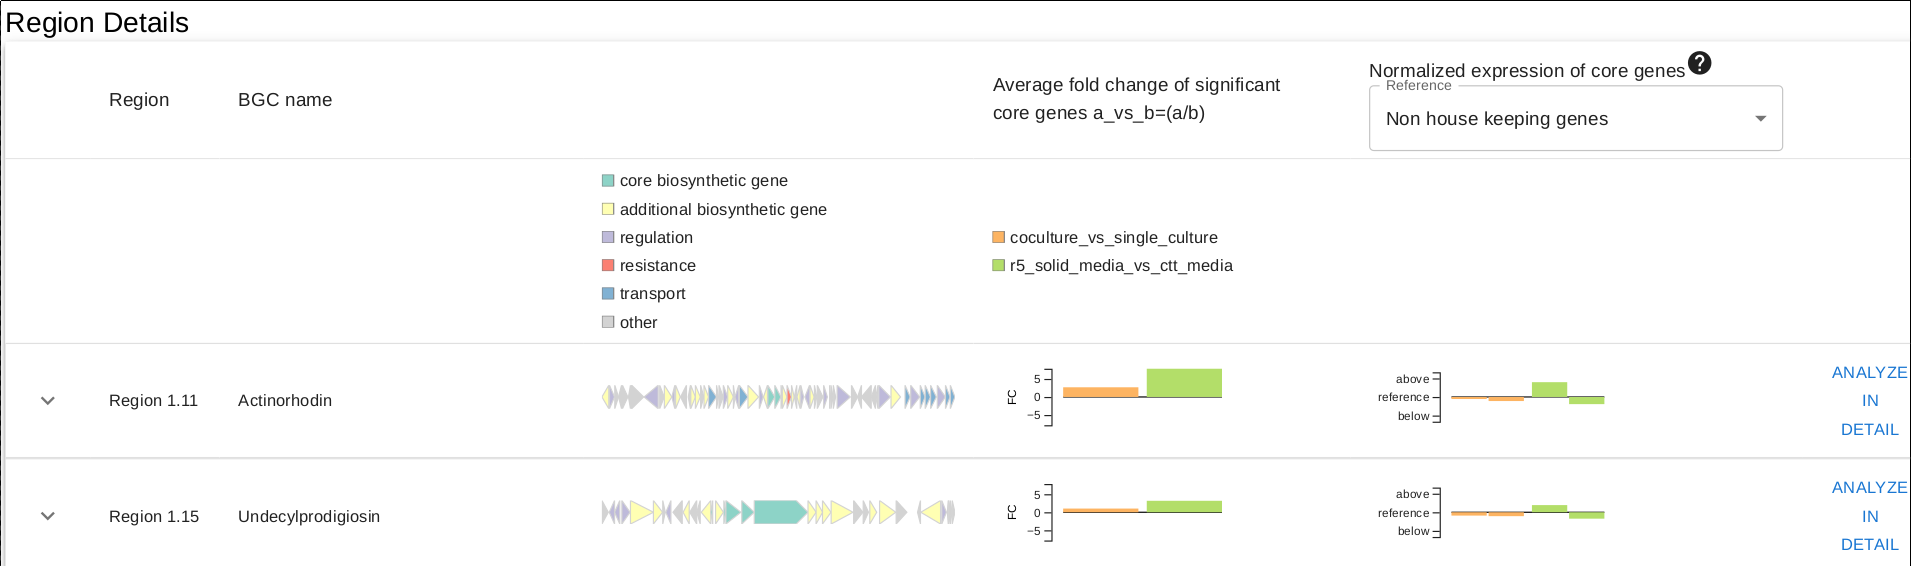
In the overview page, you will find expression information of detected BGCs based on your RNA-seq experiments. Overview can be sorted by the selected column title e.g. "Average fold change..."

  1. "Region" column denotes the region numbers given by antiSMASH.
  2. "BGC name" column denotes a similar (if similarity is detected by antiSMASH) BGC defined in MiBIG.
  3. Third column is the overview of genes residing in the BGC, pretty self-explanatory.
  4. Average fold change column simply shows a summary of the fold change (calculated from core biosynthetic genes) between conditions for each experiment for the respective BGC.
  5. Final column is a simple representation of the BGCs expression level, compared to specific references:
    1. "Housekeeping genes": Mean value of expression levels (TPMs) of all the housekeeping genes detected in the genome
    2. "Non housekeeping genes": Mean value of expression levels (TPMs) of all the non housekeeping genes detected in the genome
    3. "Mean expression": Mean value of expression levels (TPMs) of all the genes in the genome.


Single BGC overview

If the button left of the "Region" column is clicked, there will be an overview of a single BGC in terms of the expressions and fold changes of all the genes inside the cluster, per experiment. Genes marked inside black boxes are the "core biosynthetic" genes defined by antiSMASH.

View BGC expression in detail

Once the "ANALYZE IN DETAIL" button is clicked for a BGC in the overview page, you will be directed to BGC specific results. At the top part, the settings for visualization can be found. In detail, you can view "Fold changes" or "Normalized expression" (TPM) values in selected experiments and search for specific KEGG terms throughout the genome or cluster. "Secondary Metabolism Specific" KEGG terms describes genes which are also annotated in "biosynthesis of secondary metabolites" or "biosynthesis of antibiotics" pathways ("ko01130", "ko01110").

Second part of detailed BGC analysis involves the visualization of the expression/fold-change of selected BGC and selected genes from KEGG or other sources in the page. Here you can search by genes and their neighbouring genes by "gene id" or clicking specific genes from the tables shown in the bottom part of the page.

Finally, you can explore the genes that have co-regulated the most with your BGC of interest based on your experiments. At the top part you can select functional annotation of the genes that are mostly responsible for BGC expression such as "Transport", "Regulation", "Resistance genes". Since we have selected (seen two images above) to view the "drug exporter" genes, such functionally annotated genes are highlighted. Concordant regulation means that the gene and the BGC have the same expression change direction e.g. both are over-expressed/under-expressed. Discordant denotes that the expression changes are reversely correlated e.g. a specific repressor is under-expressed and the BGC is over-expressed. The "SCO6666" gene is shown to be regulating "actinorhodin" expression by Lee, N., Kim, W., Chung, J. et al. Please note that a high score doesn’t necessarily prove an association between a BGC and a gene. It rather points to high expression changes in the different conditions relative to a BGC of interest.

Contact

Email: sematrap.support@ziemertlab.com

University of Tuebingen
Dept. Microbiology and Biotechnology
Auf der Morgenstelle 28,
72076 Tübingen, Germany